Interpreting the History of the DEA
The arrival of social restrictions didn’t stop my team from delivering human-centered design solutions for the DEA Museum.

Meet the Client
The DEA Museum is a repository for artifacts related to the DEA and its predecessor agencies, drug policy, drug law enforcement activities, drug education, and the history of drug misuse and addiction in the United States.
The museum interprets the collection for the public benefit through permanent and temporary exhibits, programs, the museum website, publications, social media, and other mediums. The artifacts, documents, photos, oral histories, and other materials comprising the collection support the DEA’s educational outreach mission.
In 2020 the museum completed the first full redesign of its physical location. A new design language united the exhibits by incorporating their educational themes and content into a rich visual vocabulary informed by history, policy, and the material record.
What We Did
The DEA asked Bixal to create a new web presence that would support the museum’s new identity. My team engineered an experience that complemented and amplified the museum’s educational message.
A new, modern visual design brought the museum’s web presence out of 1999 and into the present. New information architecture and content strategy informed by research built the public’s trust for the institution and its message, and new online exhibits supported the messaging of the physical space.
The Human-Centered Strategy
Thinking less about the how and more about the why
Most museums are destinations. People set their intention to visit and go searching for the information they need to make that visit happen. The DEA Museum is unique in that the majority of visitors arrive as part of a guided group. They do not decide to attend and them figure out how. The destination is chosen for them by their school teacher, scout leader, or other educational role.
The question of strategy, then, shifts away from show the site can best share information about location and hours and towards how it can best support the goals of these groups and, by proxy, the educational mission of the DEA’s outreach programs.
Tactics in COVID
The arrival of the pandemic and restrictions on social distancing limited the team’s ability to run traditional human-centered research techniques. In-person interviews and site visits were limited or prohibitively complex to arrange. What’s more, the general situation was so fluid that it was next to impossible to plan with any confidence more than a couple of weeks ahead. We adapted by maintaining multiple, parallel tracks of research and design.
We educated ourselves with prior research and market research, read museum journals, and documented site visits with video. We anticipated the questions that needed answering and worked backward to build research plans that would support quantitative analysis.
Website analytics and data from internal site searches provided basic demographics and insight into pain points. Blending multiple sources of data together revealed patterns and connections that would shape the new site’s information architecture
We made heavy use of surveys and tests to capture the perspectives of the audiences. We explored travel trends with market data and surveys, captured mental models with card sorting, and validated design decisions with impression testing.
Building Empathy
Successful human-centered design is informed by a combination of quantitative and qualitative research.
There is no magic formula for determining the proper proportions of each. Instead, they exist as part of an ongoing dialog with each other that evolves and responds as new data come in, new insights arise, and the project matures.
We used this fluidity to our advantage by tapping multiple sources of insight that we would likely not have considered before the pandemic.
The Voice of the Customer
The first source of insight was the Voice of the Customer (VoC). VoC is what people themselves tell us about their experiences. Feedback typically takes the form of email, SMS text, webforms or outbound call surveys, ratings and reviews, social media feedback, call center log analysis, and so on.
We explored nearly a decade’s worth of data from visitor notes, observations, and education staff interviews. One outcome of this work was the identification of six categories of exhibit audiences representing the different types of people visiting the museum.
The people in these groups fell into one of two camps: members of the general public who arrived without an appointment, and those who were connected with education or research.
The Voice of Analytics


The second source of insight was the Voice of Analytics (VoA). VoA data is driven by what we can determine about the customer’s experience from digital analytics, and by observing how they interact with the website.
We analyzed two and a half years' worth of questions people asked Google for which the DEA museum was offered as a possible answer.
When people are curious about visiting, they tend to search for the museum directly. They place the most value on the museum’s hours of operation and information about tours. When people are educators or interested in education, they also search for information about tours but tend to arrive after expressing an interest in subjects tied to the history of the DEA.
Where did people look for answers?
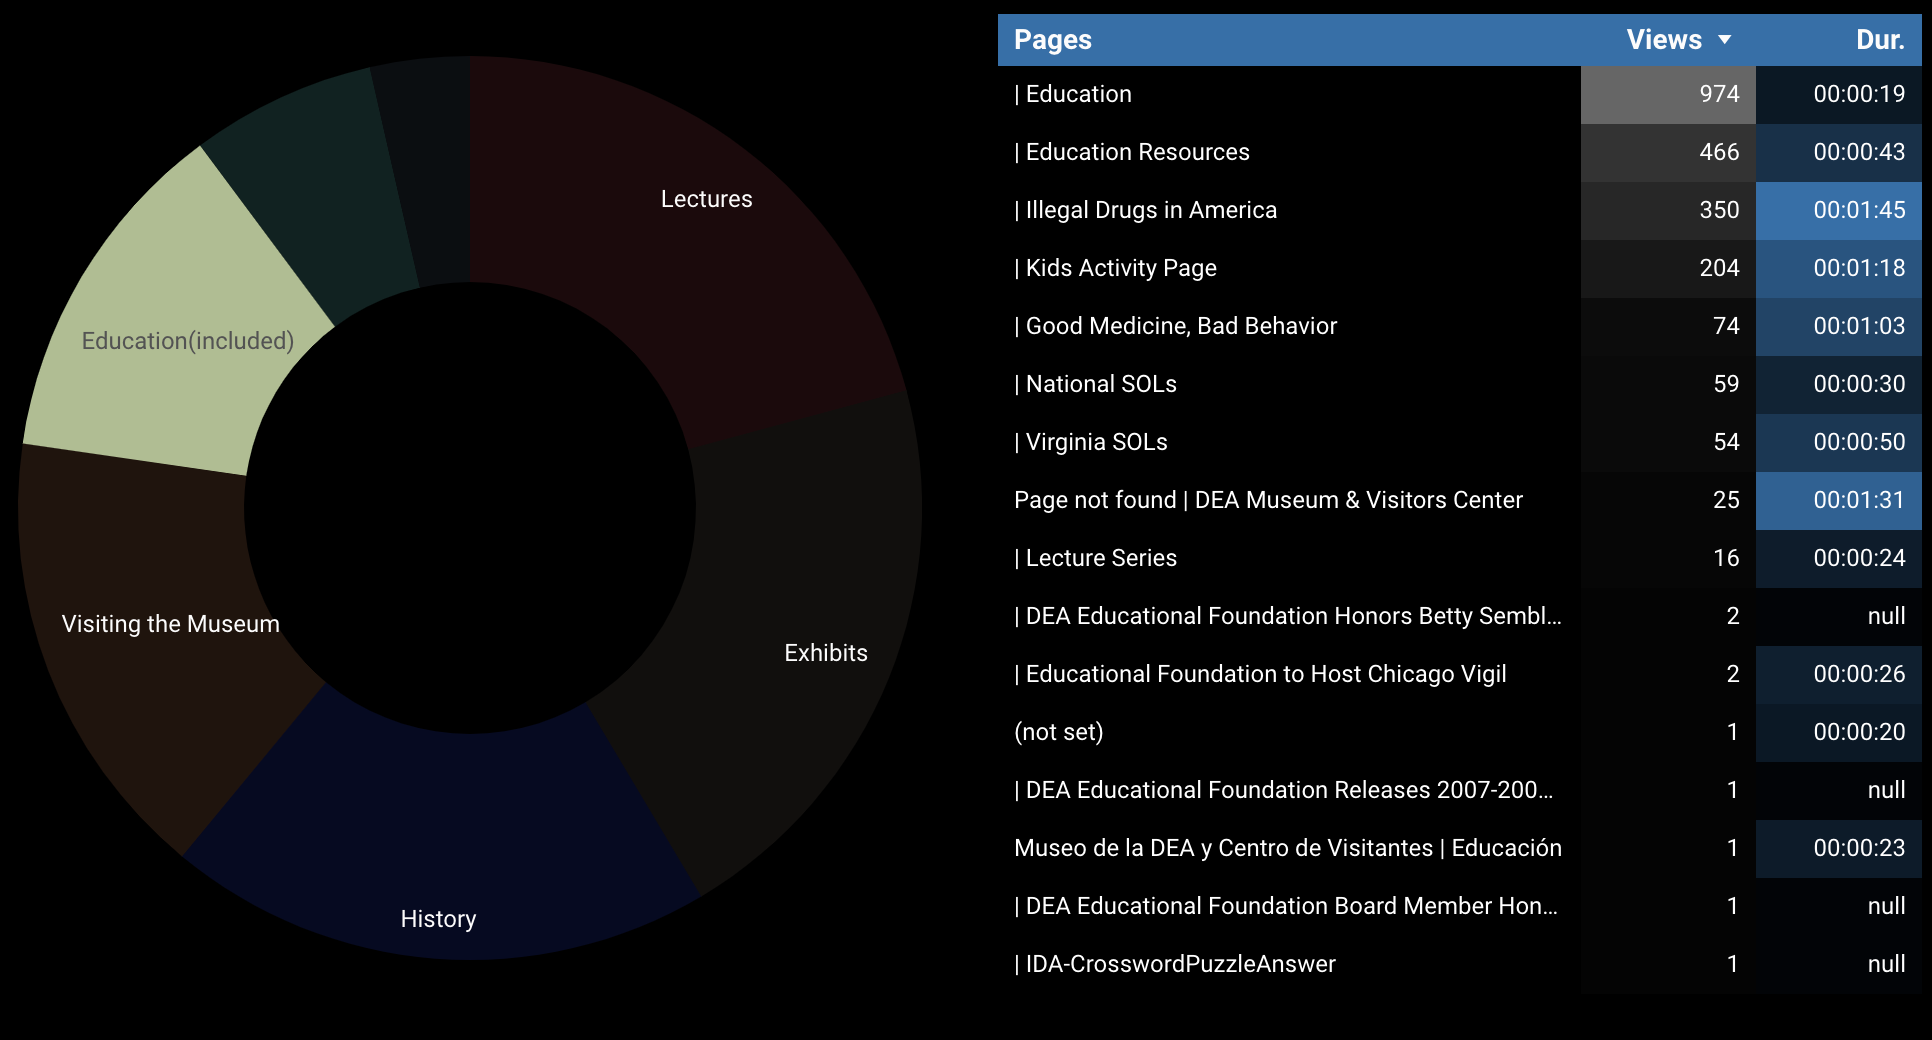
When those same people visited the site, their content consumption tended to center around subject matter rather than visiting the museum. Instead of directions and hours as one might expect from other museums, approximately half of the page views on museum.dea.gov are for content relating to history and lectures.

Building Mental Models Through Card Sorting

The focus of research up to this point was on using quantitative analysis to build a sense of people who intersect with the museum in some way.
We knew the general demographic breakdown of people who visited the museum in person. The general public made up the majority, but school and scout groups were also solidly represented. We also knew that people’s behavior on the website is defined by their information needs and that these needs vary. What we needed to know next was how to best organize that information. To do that, we ran a card sorting exercise.
The card sorting exercise explored how people understood and organized information relating to museums.
Participants were presented with a list of museum-related topics. Their task was to sort them in the way that made the most sense to them.
The topics for the card sort came from the initial research into the landscape and through competitive analysis of other museums and similar institutions.
Primary Groups

We used a diagram called a similarity matrix to identify patterns in how participants grouped their cards. The identification of these patterns was validated by comparing different researchers' interpretations of the matrix.
Secondary Groups

We also accounted for patterns that existed across multiple groups. These secondary relationships are defined by context and support casual browsing and discovery. The relationships provide opportunities for adding value to the person's experience with suggested content like related articles, calls-to-action, and other pages.
Semantic Associations

The similarity matrix revealed the primary and secondary relationships among different topics. The next step was to understand why specific groups existed and what defined them.
A heuristic analysis produced descriptions of the groups. These descriptions established a common language for the team and the client. The actual labels would be defined later.
Clustering Analysis
The work up to this point focused on identifying patterns in how people grouped topics. Using patterns of co-occurrence in the data in combination with the shared meaning of the topics in each group, we refined the five groups into four.
These four groups would form the foundation of the site’s information architecture.
